
As great as online creators such as Canva and Piktochart are, there are times that you need or want to create something without being Online.
Plus, if you are only using the free versions then you can be limited in what templates and other images you can use.
So, here’s an off the radar alternative called Microsoft Publisher.
I must confess that I have being using publisher for many years now and have used it in the past for brochures, flyers, and books so I’m a bit biased.
Now there are number of ways you can get publisher the most popular way being through an Office 365 subscription service which cost around $70 a year for the complete suite of offices software such as Word, Excel, PowerPoint, Outlook, OneNote and Publisher and a couple of others. But you can buy it outright for around $110.00 if you don’t wish to subscribe.
So how to use it:
- Open the program (that’s a big step)
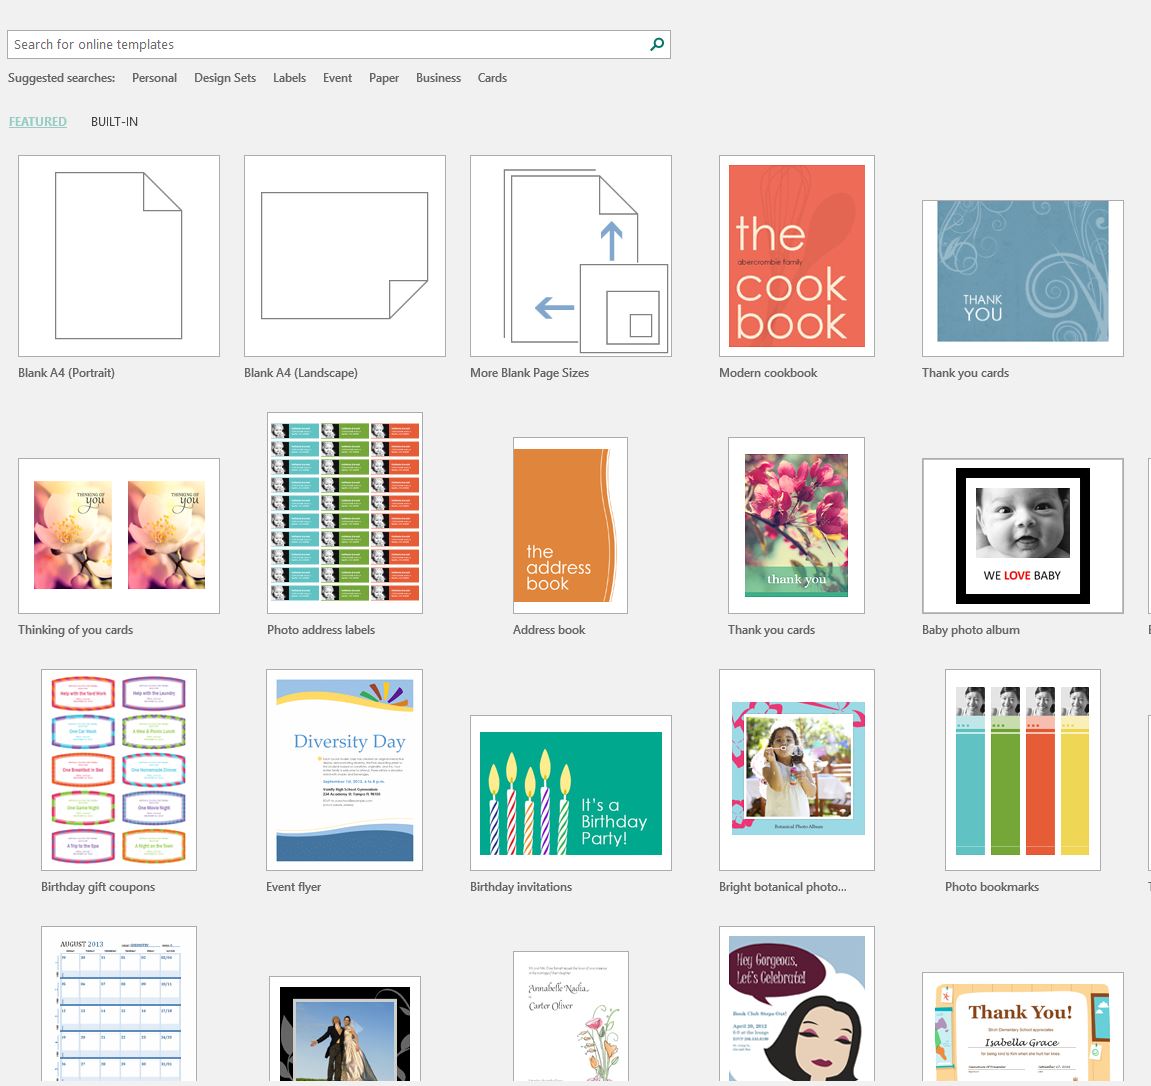
- On the first page, you will get many choices of pages with templates etc. for the example I have used here I created a blank publication of A4
Now the fun begins.
- You can easily change the size of the publication by the drop down menu under page design. You have choice of selecting a standard size or creating a new page size

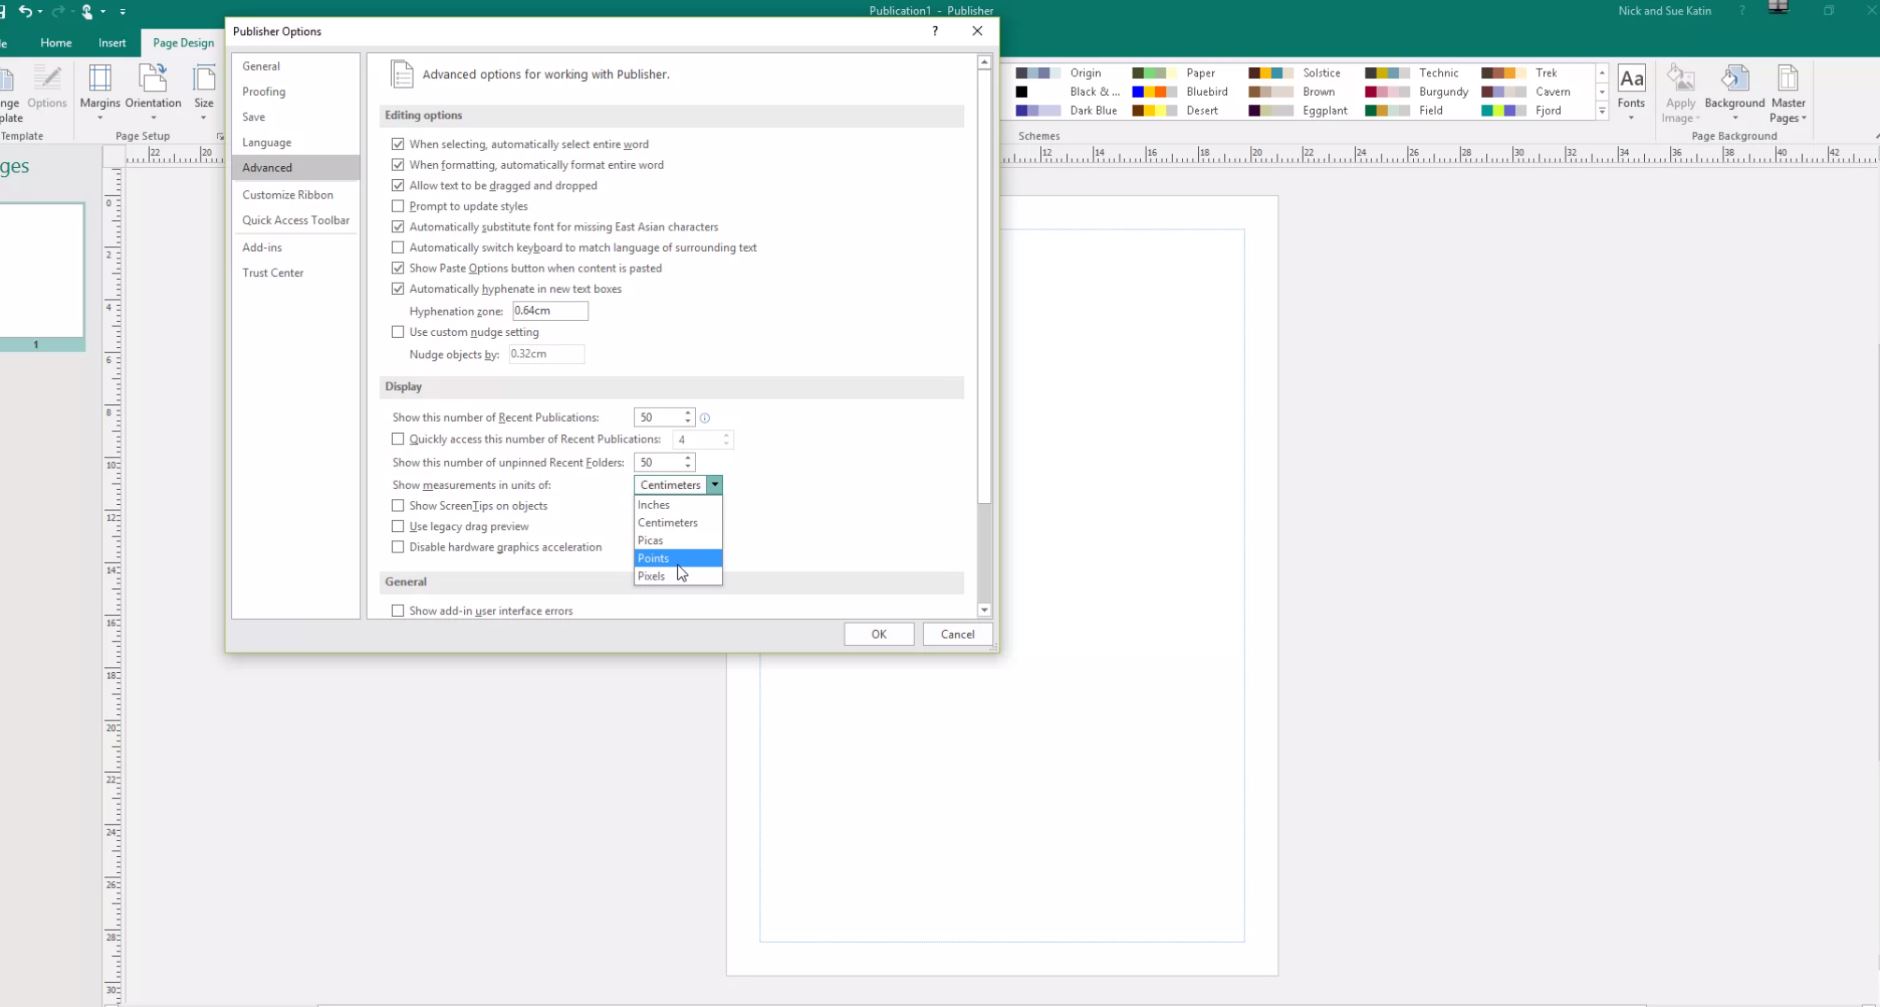
If you prefer to change to unit of measurement e.g. pixels then go to the options menu under file and find advanced. Display is the second area

- Now that you have created a blank page of whatever size you want, let’s do some creating
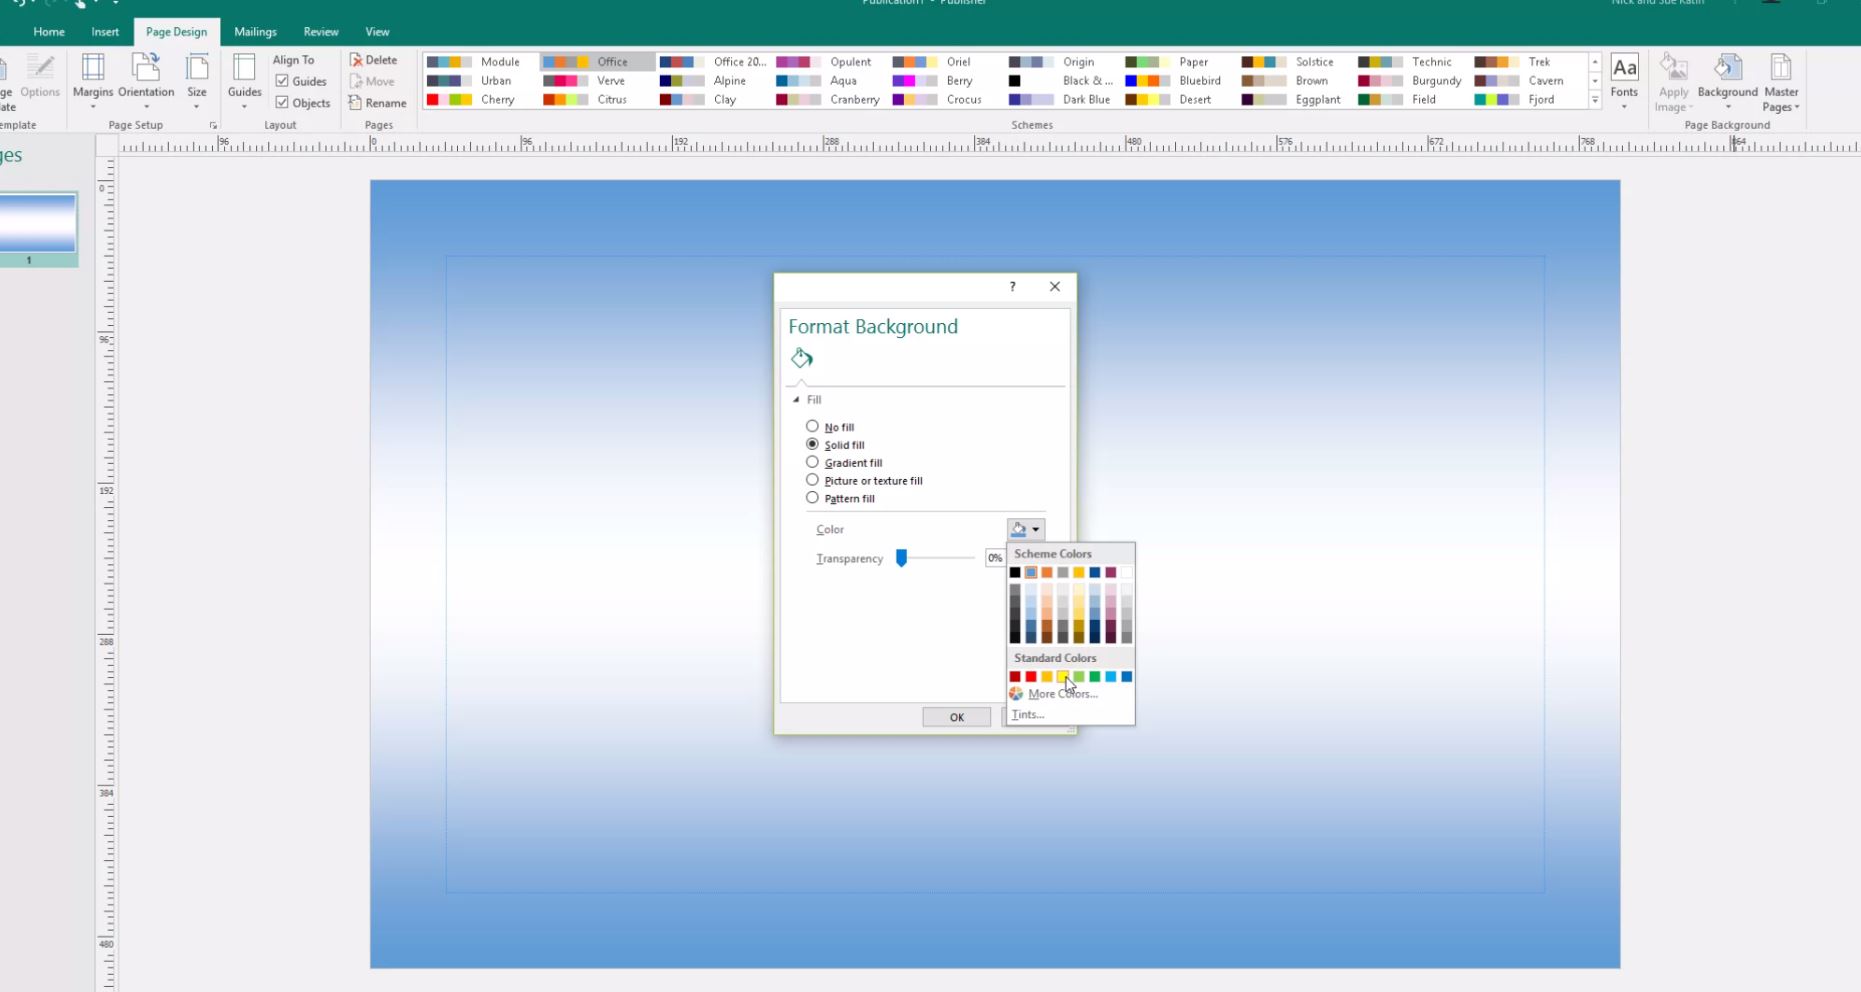
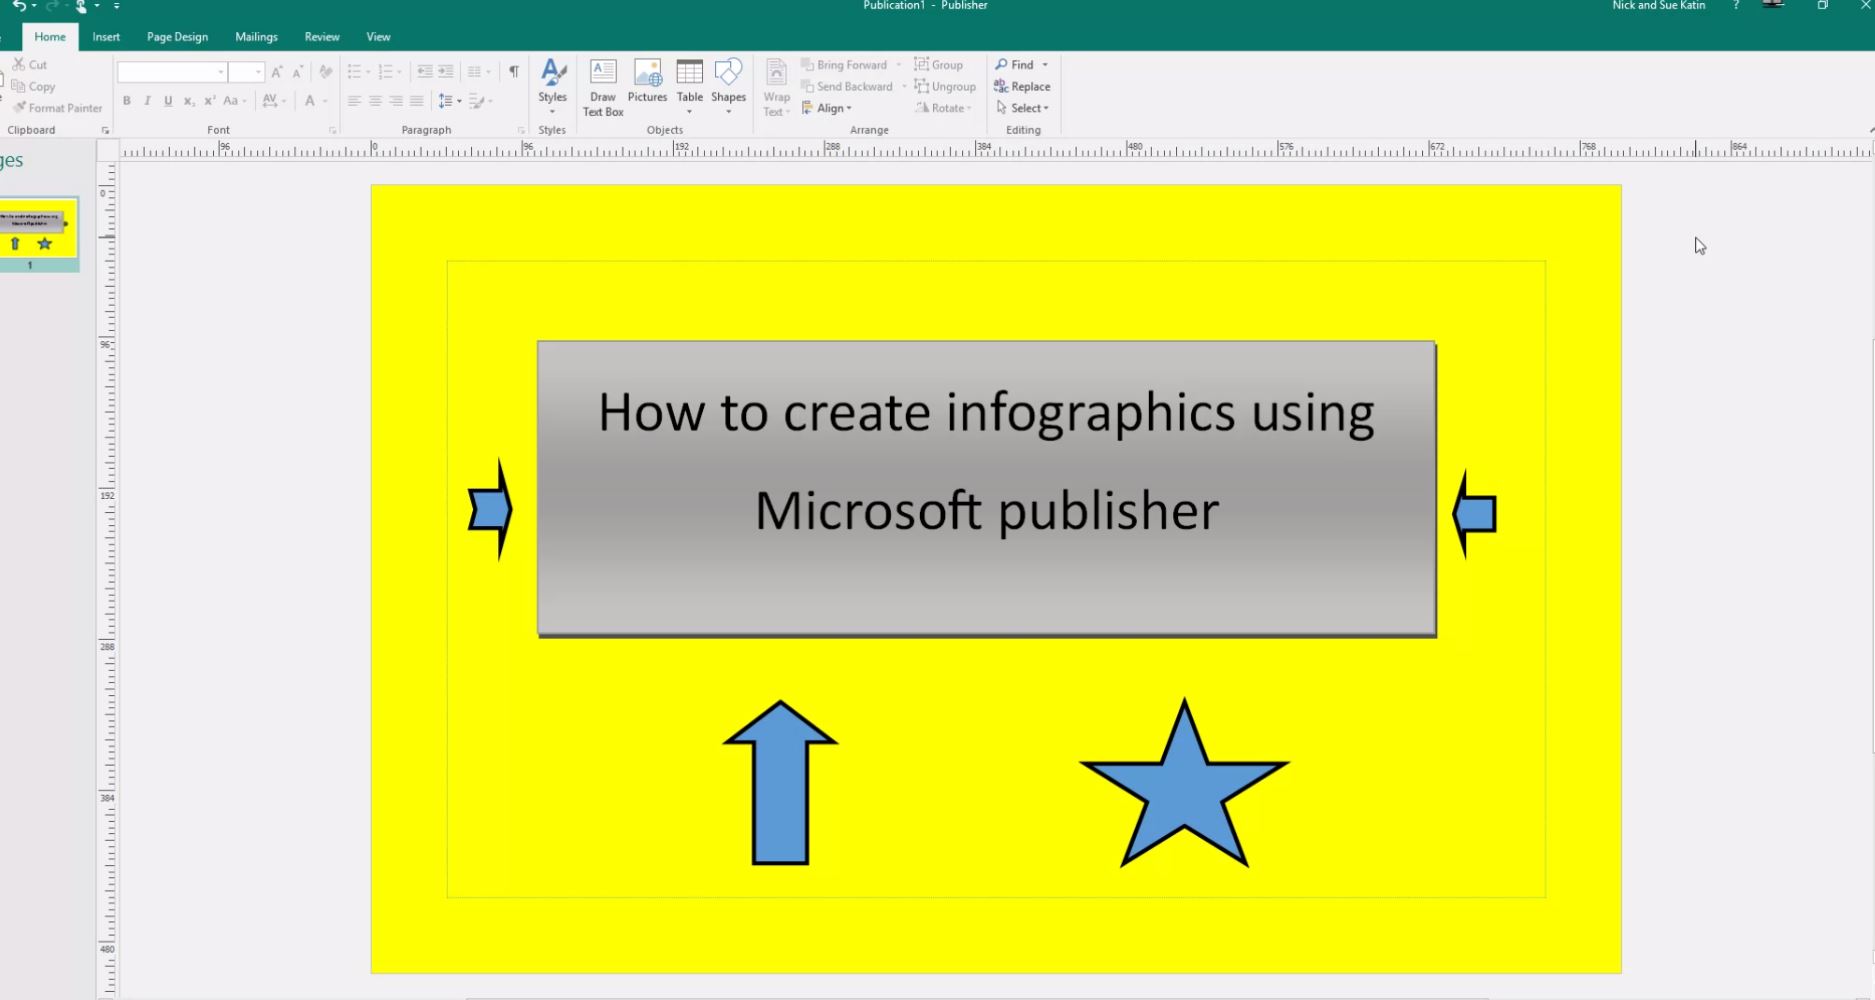
- I usually select the background colour by going to the background drop down menu under page design. You can select some standard variations or make your own

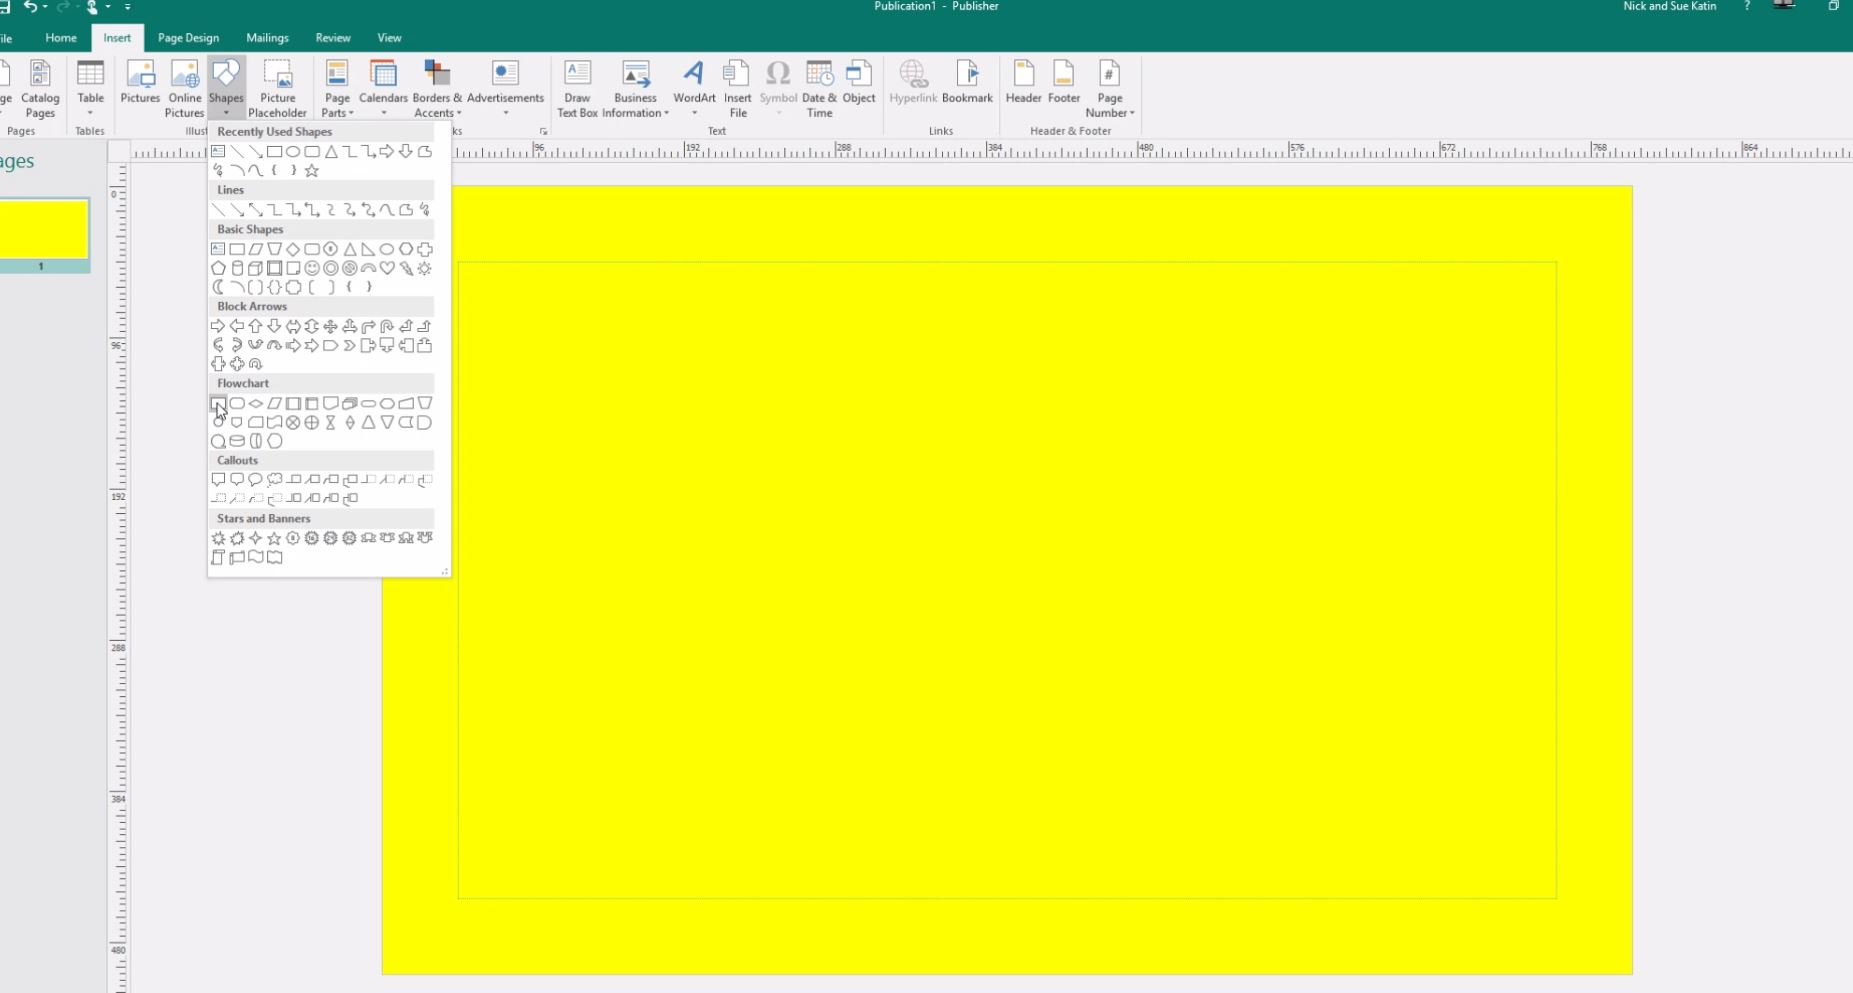
- Ok let’s stick some shapes in. From the insert tab there’s a drop down menu under shapes and you can knock yourself out inserting all sort of different shapes.
- For text go to the text section under insert and you can insert text with different fonts etc.

And that is really all there is to it.
The added benefit of publisher is that you can also insert photos add some texts and shapes etc. and then save just that page as JPEG. I use it like that for my Instagram posts.
If you have any queries on this just post them in the comments below.


Leave a comment